Factory Diagnosis
Only a mere 4% of an organization's issues are visible to top leadership.
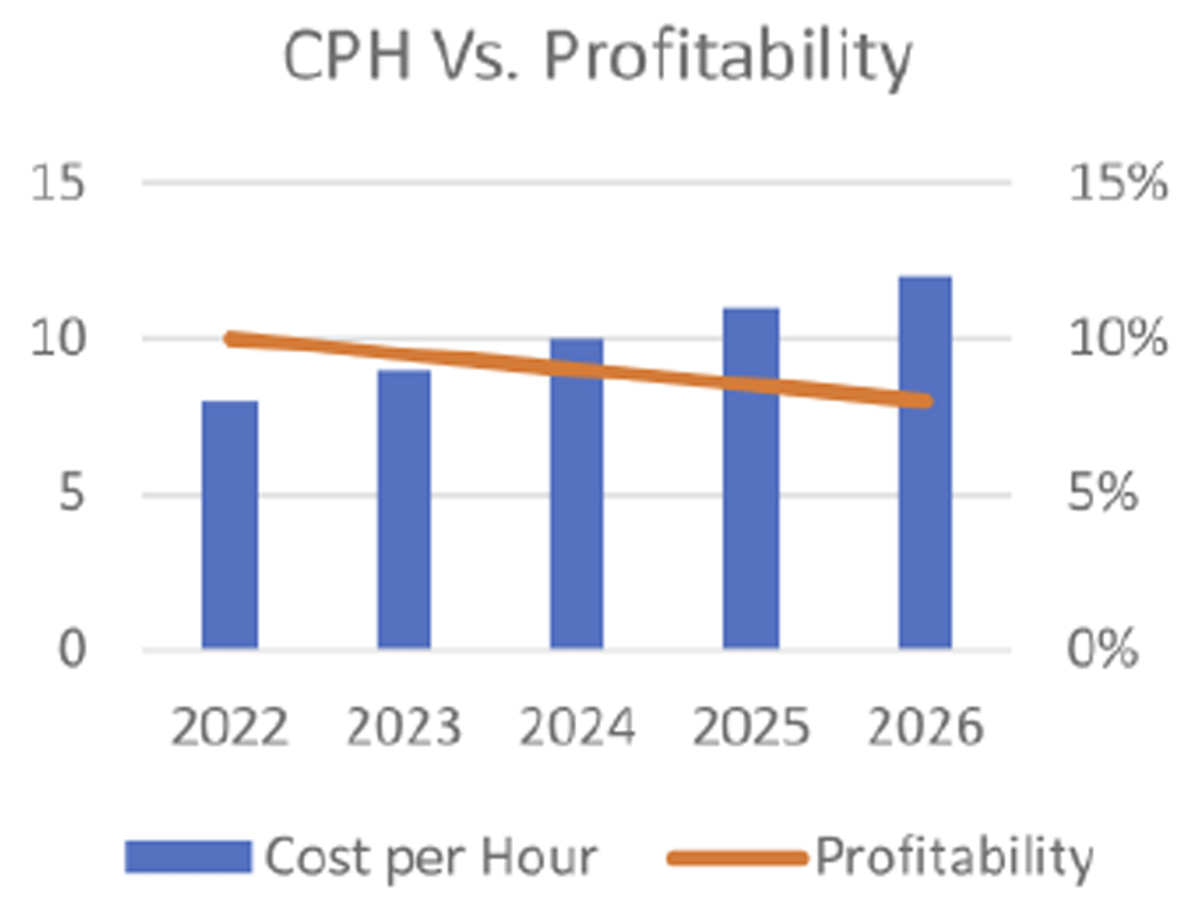
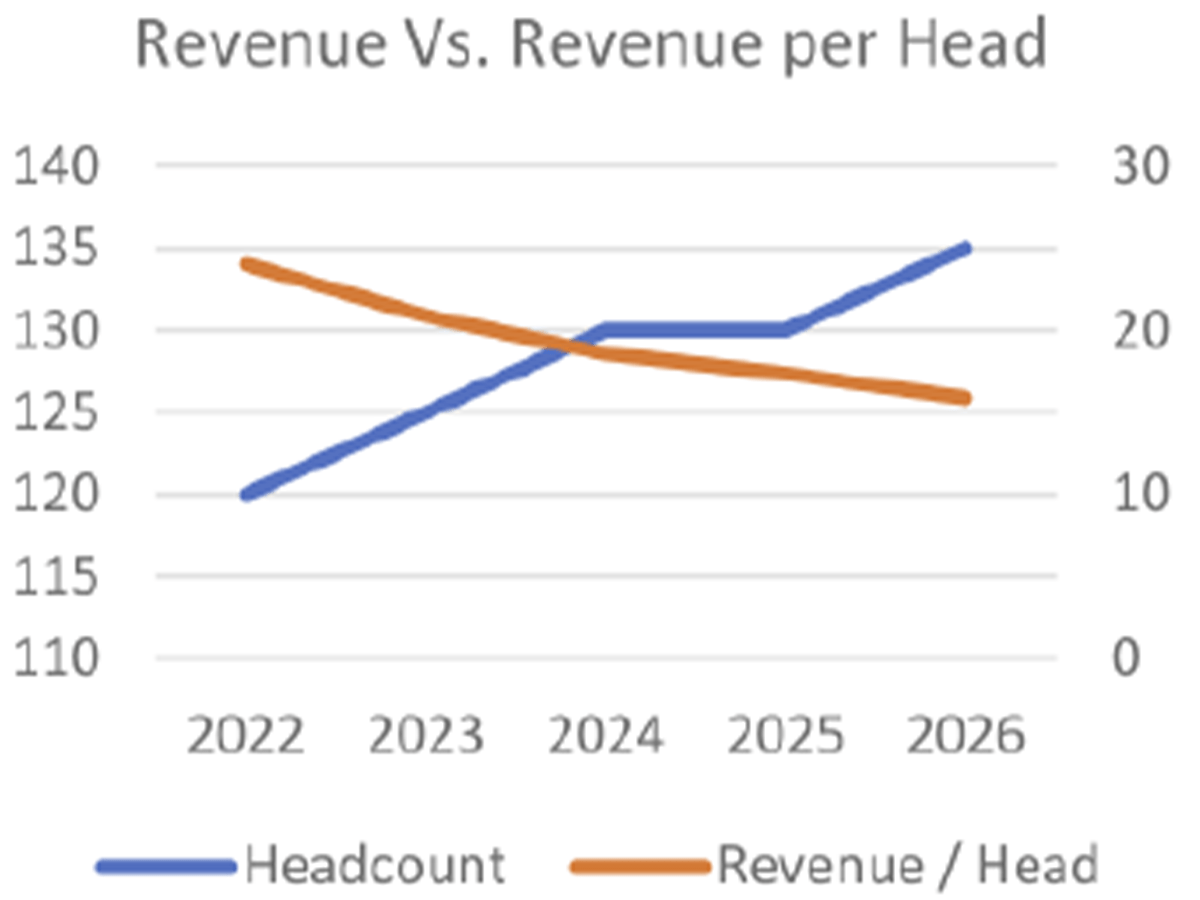
While symptoms such as declining profitability, escalating costs per hour, and diminished revenue per employee may be apparent, the underlying causes reside within the remaining 96%, unseen by leadership. Through a systematic diagnostic approach, we aim to uncover these hidden causes and address them promptly, allowing leaders to redirect their focus towards shaping the organization’s future. Factory Diagnosis is like a comprehensive health check for your operations, designed to unveil hidden issues and boost profitability.
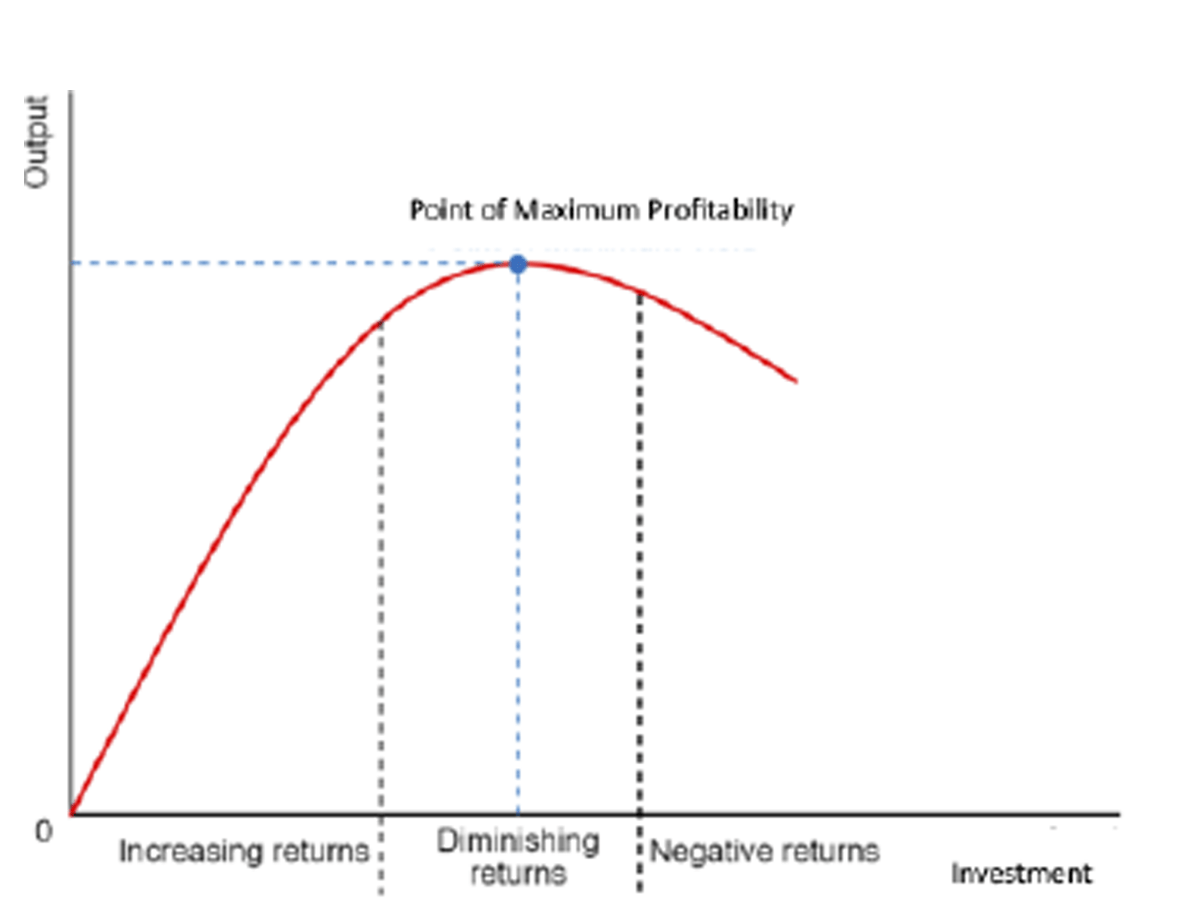
Diminishing Marginal Returns

What are the causes?
Diminishing marginal returns can significantly impact a business by reducing the efficiency of additional investments in production or other resources. As a business invests more in a particular area—such as labor, capital, or technology—the initial investments often yield substantial increases in output. However, after a certain point, each additional unit of investment contributes less to output than the previous one. This decline in productivity means that the business will face higher costs for increasingly smaller gains in output.
In practical terms, this could lead to increased expenses without a corresponding rise in revenue, squeezing profit margins. For example, if a factory hires more workers, there may initially be a significant boost in production. But as the factory becomes crowded, and resources like machinery or workspace are stretched thin, the added workers contribute less to overall output. Eventually, the cost of hiring more employees outweighs the benefits, reducing the overall profitability of the business.
To manage this, businesses need to carefully analyze the point at which additional investments no longer contribute meaningfully to growth and may need to shift resources or strategies to maintain efficiency and profitability.
Diagnosis Tools
Key methods:
Value Stream Mapping & Constraint Analysis
Estimated time:
2 weeks
Two of the most valuable tools in the lean toolbox are utilized to accurately determine hidden capacity within the business. A comprehensive value stream analysis will be conducted to assess takt time, cycle times, inventory levels, information flow status, process capability, and personnel distribution. All process inefficiencies will be identified through observations, interviews, and past data analysis.
Outcomes:
- Identification of bottleneck processes based on current takt time/customer demand
- Identification of potential bottleneck processes based on forecasts
- Calculation of total capacity loss in production hours
- Breakdown of capacity loss
- Analysis of Work In Progress (WIP) inventory
- Development of ROI and Payback models for future investments
Increased Production Cost Per Hour (CPH)

What are the causes?
Defects, recalls, customer complaints, inventory mismanagement, overtime hours, demurrage, airfreight, short-term interest, spare parts, material wastage, electricity, utility bills, transportation, and temporary workers can incur significant losses. Simply meeting budgeted defect rates or losses should not suffice, as preventable downtime or defects should be intolerable for any business.
Many of these issues have interconnected causes, where one factor may lead to multiple losses across various areas. For example, defects can result in manpower hours, wasted materials, airfreight expenses, and utility costs. This cumulative waste drives up the cost per hour (CPH) and erodes company profits.
Loss Cost Diagnosis
Key methods:
16 Losses Overall Equipment Effectiveness (OEE) First Time Through (FTT) Delivery In Full On Time (DIFOT)
Estimated Duration:
4 weeks
A comprehensive diagnosis involves past data analysis, focused studies, and design of experiments. This study quantifies total losses within the company, segregating them by department and loss type. Additionally, potential financial losses stemming from these operational losses are calculated.
Outcomes:
- Quantification of losses by department and loss type
- Financial losses attributed to operational losses in each department
- Potential capacity and cost savings in each department
- Projected increase in CPH and bottom-line impact over 12 months
Reduced Earning Per Head (EPH)

What are the causes?
This phenomenon often occurs in mature companies. Following a period of growth and profitability, companies may experience a decline in profitability, largely attributed to excessive overhead in processes. One of the underlying causes is the lack of standardization and rationalization in work practices, as well as a deficiency in multiskilling and job rotation within the organization. Additionally, inadequate protocols in recruitment processes can exacerbate this issue. During challenging periods, companies may need to streamline their workforce to achieve more with fewer resources.
Manpower Diagnosis
Key methods:
Process Study Motion Study Standardized Work Type I & III Work Combination Charts Yamazumi
Estimated Duration:
2 weeks (Dependent on the scale of the study)
A comprehensive diagnosis report is generated, estimating the manpower requirements using sampling work study techniques. This study assesses both direct and indirect workers to identify work elements, repetitive tasks, and interdependencies. Past data analysis and statistical methods are employed to determine the optimal workforce size for the organization.
Outcomes:
- Department-wise analysis of current versus required manpower
- Detailed breakdown of work elements and time for each job role
- Identification of repetitive, periodic, idle, and variation times
- Recommendations for work standardization and multiskilling
Cultural Stagnation

What are the causes?
Culture in an organization reflects the way things are done, influenced by various factors including founder beliefs, leadership behavior, reward systems, company vision, processes, product management, people development, and team beliefs. Without intentional efforts to define culture, organic growth may lead to islands of excellence and people-driven processes, fostering power imbalances and organizational politics. Developing an XOS, or Your company (X) Operation System, is crucial to establish a unified operating system.
Lean Maturity Index
Estimated Duration:
4 Days
This comprehensive organizational diagnosis assesses both culture and process maturity levels across six key areas, benchmarking against world-class manufacturers like Toyota Motor Corporation. The assessment evaluates:
Outcomes:
- Current phase level compared to world-class manufacturing systems.
- Detailed analysis of each element, with recommendations for advancement.
- Overall recommendations and action plans.
Hoshin Alignment:
Alignment of leadership vision throughout the organization
Value Stream Management:
Management of material and information flow from end to end
Manufacturing Stability:
Capability of the manufacturing system to consistently produce defect-free products on time with minimal resource utilization
Built-In Quality:
Management of quality processes and escalation of problem-solving to management
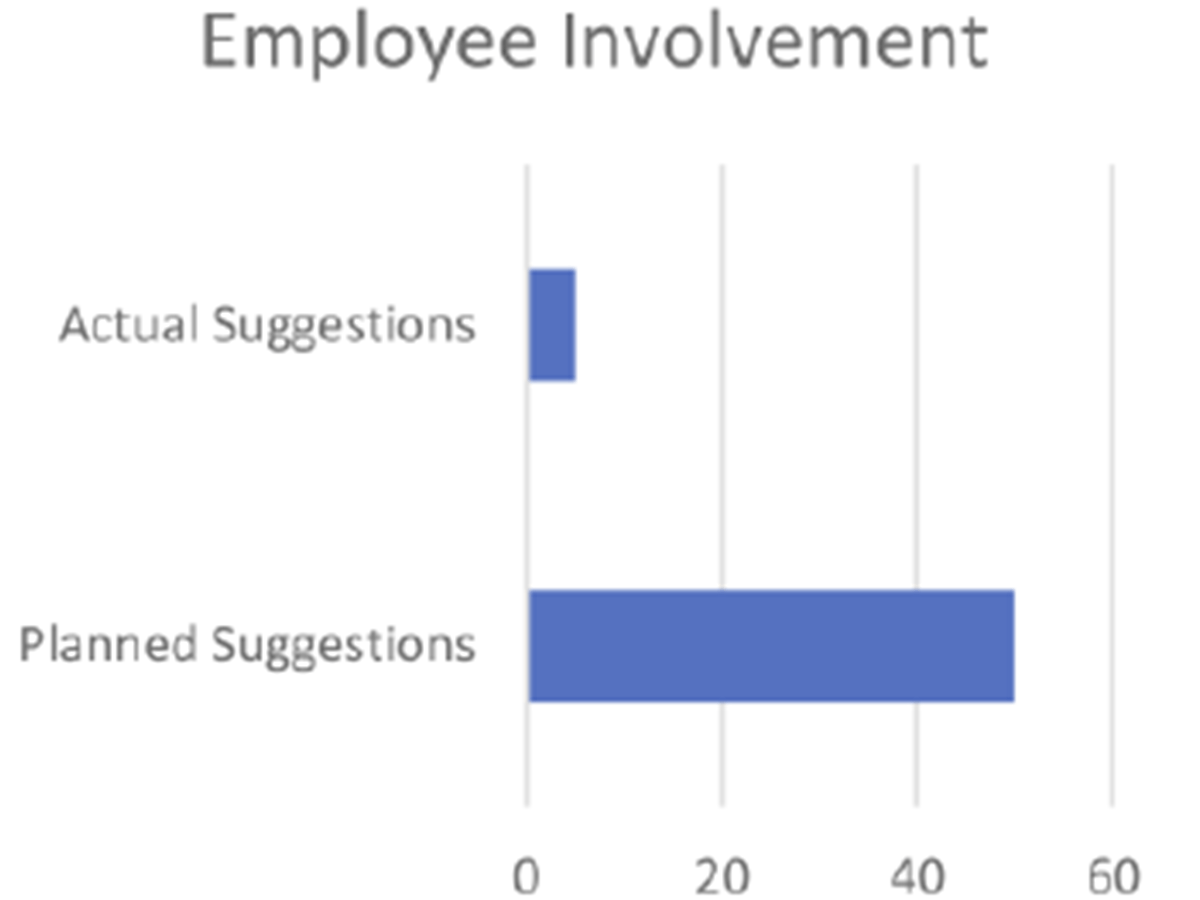
Continuous Improvement Mindset:
Employee participation in continuous improvements
People Side of Lean:
Evaluation of cultural aspects such as psychological safety, sense of accomplishment, and belongingness
Hidden Cost in Digitalization

What are the causes?
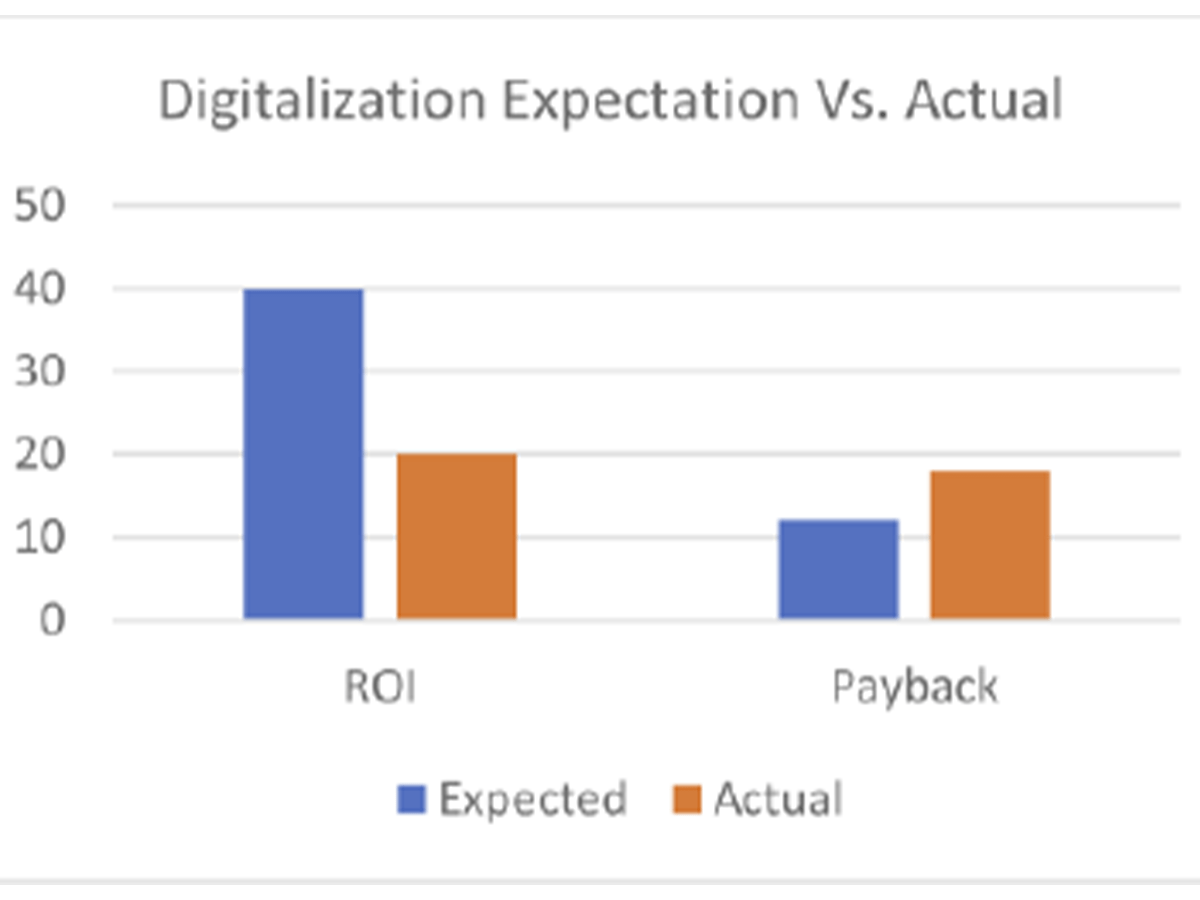
Forbes has assessed the risk of failure in digital transformation to be as high as 84%. While digitalization is imperative, many companies fail to achieve anticipated success due to various factors, including inadequate change management, feasibility assessment, and resource planning, as well as incomplete requirement gathering. However, companies can mitigate risks and proactively address issues by conducting a comprehensive feasibility study before initiating digitalization efforts.
Digital Feasibility Study
Duration:
2 Weeks
We offer a unique Digital Feasibility Study to understand the current state of processes and potential future states post-implementation. This study facilitates the estimation of payback, ROI, and resource change management efforts required for successful digitalization.
Outcomes:
- Detailed current and future state process maps
- Assessment of impact on existing processes, capacity, and key operational indicators post-digitalization
- Quantification of payback, ROI, and overall financial impact
- Risk assessment for change readiness
- Recommendations and action plans

